Yesterday I showed you XOM which looked rather bullish even though it hadn’t yet broken out of its range.
The reason I highlighted it was to demonstrate the power of the OVI-chart pattern combination to anticipate potential breakouts with zero risk whatsoever.
Since my note the stock has jumped 3.4%, and is drifting up towards the resistance level at the top of the channel. Remember, the play is once it breaks out from the range, but it’s the vision the OVI gives me even before a move manifests – this is what gives us the intuition for the markets. It’s the unique OVI-chart pattern combination.
It’s really just a glimpse of how I see things using this rather special tool.
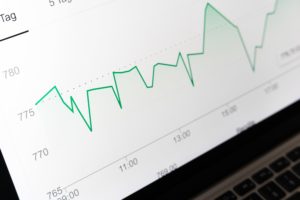
With XOM the OVI has been consistently (albeit unspectacularly) positive since early February but hasn’t yet broken out from its high set in January.
XOM

Now for one I prepared earlier … AAPL. This has now risen by $150 since I originally highlighted it at the very end of December. It’s the classic combination of the OVI and a neat flag pattern. And guess what … it’s just done it again! The OVI is still positive and AAPL continues to go from strength to strength. Look at the breaks of the dotted line for the easiest breakout points so far since January.
AAPL

The OVI Dashboard:
While writing, just a quick word on the OVI Dashboard and App. Here are a few snapshots of what’s to come. I should add that we haven’t quite settled on the design yet but we’re getting closer.
The first screen you’ll see is our market summary according to our parameters of OVI and flags for the whole market and then the S&P500:

When you click on one of the pies, you get an expanded version for that particular filter, showing you a few stocks which fit that particular criteria. Non-paid members will see around five stocks for bulls and bears, while full members of FlagTrader and the OVI Traders Club combination will receive the entire list of results and more benefits.

Click on a particular stock in this filter and you get the details for that stock including all of our proprietary information and OVI chart for the stock.

Click on the “i” button at the top right of the screen and view our education tutorials and online videos.

The Smartphone App will be similar to this concept.
It goes without saying, the OVI Dashboard has become more than I originally envisioned, but it’s going to be like a friend to you, both on your desktop and your smartphone.
All the best
Guy Cohen