In the drive to make thing simpler and better, sometimes it’s easy to get caught up in creativity, and that’s what’s been happening with me recently!
Introducing “The Widget”
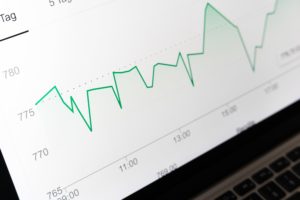
The Widget is a neat summary of the market using our proprietary methods and indicators, namely flags, trends, and the OVI. The idea is that when we release it in the next few weeks it will also hyperlink to our TradeFinders and other tools.
As you can see, it summarizes our flag counts, (bull and bear) and OVI readings in various permutations and combinations, giving you a tally of stocks that fit a particular filter. I’m still considering other potential combinations and just need to get the user interface right and then we’ll release it in various forms depending on your membership level.
We’ll also be working on making it into an app for your iPhone, iPad and Android devices.
This screenshot is not the finished article and contains test data from a few days ago, but gives you an idea.

Right now we’re in the middle of Earnings Season and generally the markets have been buoyant throughout January. This is a decent sign with the OVI on many stocks consistently in positive territory.
Just a couple of stocks I want to mention today.
AAPL
This was such an easy trade. We have a textbook bull flag at the beginning of the month, combined with an OVI that had been positive for the entire previous month. It really doesn’t get much easier than this, once the stock breaks out.
The first chart shows the initial setup at the beginning of January – a wonderfully positive OVI with a textbook bull flag:

The second chart shows the breakout and where you could take your partial or full profits:

From here, the next consideration is that earnings was around the corner. If you’d bought enough lots/shares/contracts in the first place, you could keep a few chips on the table and take a view on earnings, bearing in mind the very positive OVI and solid stock chart performance. What you do NOT want to do is gamble everything on earnings. But say if you’d taken 50% profits or preferably more by this point in time, at least you’d be playing earnings with your profits and not your initial stake money.
Here’s what then happened at earnings:

A $30+ leap in AAPL stock price and really none of it could have been a surprise, given the OVI’s behavior and how the stock was behaving.
ILMN:
Now let’s take a look at ILMN. Take a look at this OVI behavior where it spikes up all of a sudden. Now, typically this stock’s OVI doesn’t do much but the stock itself is in a nice bowl pattern, which is bullish. Suddenly the OVI spikes up. Normally that wouldn’t get my attention as a single spike often doesn’t correlate with a big move in the stock. What we normally like to see is a number of days with the OVI being positive before the stock breaks out of a range or flag. However, the spike does reveal activity on this particular day:

So now see what happened the next day … a bid is announced for the company … and the stock gaps up almost $20!

Why is this important if you couldn’t have traded it? Well, it’s yet more clear evidence that the OVI does reveal insider and informed activities that other indicators cannot get near. Sometimes they’ll be tradeable and sometimes not. We focus on the really obvious and SAFE opportunities. Sometimes these opportunities will arise through “naughty” activities and sometimes they’ll arise purely as a result of options traders being savvy.
Either way, the OVI combined with our preferred chart patterns is a phenomenal way to trade, both in terms of efficacy and safety.
All the best and see you soon.
Guy Cohen