Another week, and more inconsistent earnings results with a number of upside and downside surges.
As I’ve mentioned over the past couple of months, we are most likely in a multi-month basing period, which means there will be tradeable moves up and down, with the caveat of strict trade management.
Right now, we’ve had a good move since the June lows. While there are plenty of bullish looking consolidations and large pies showing on the Dashboard for bullish breaches of the 200 and 50 day averages, there are a couple of our OVI indicators that suggest that this up move will stall quite soon.
First, post earnings has been a mixed bag.
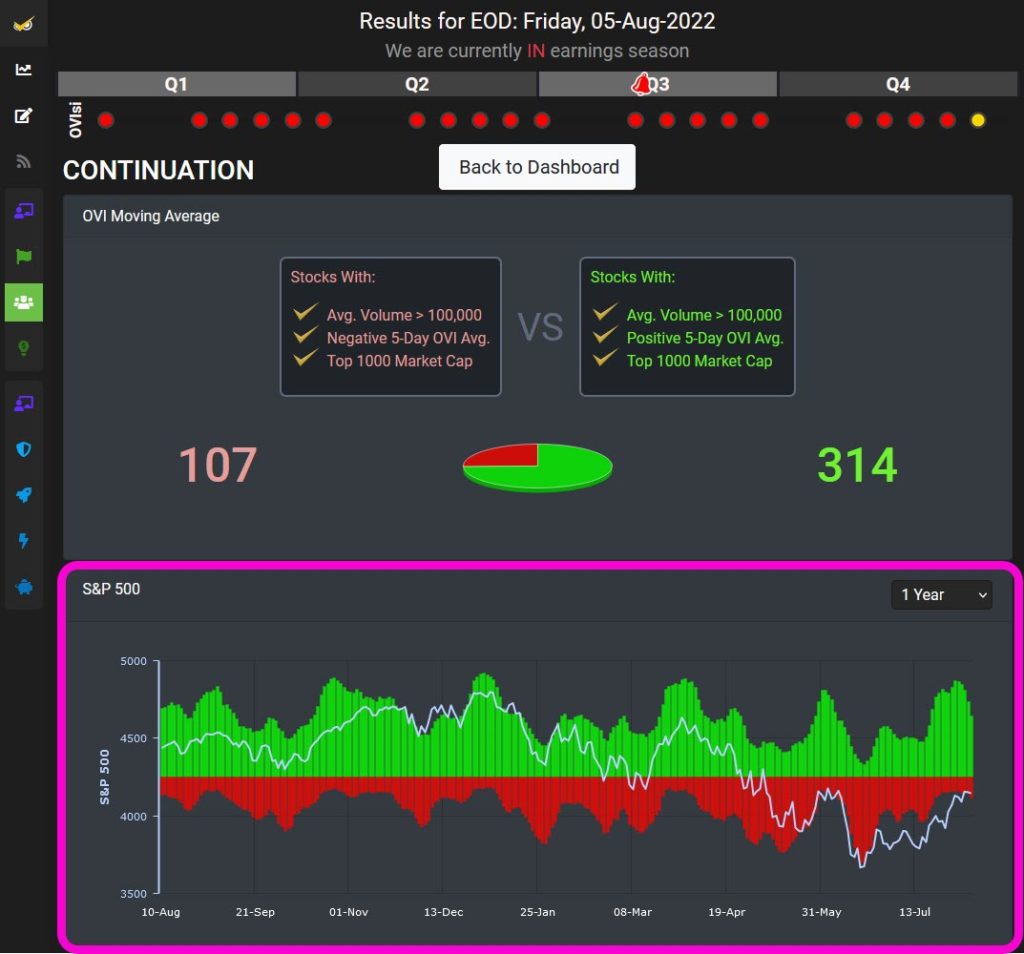
Second, look at the histogram image below. It represents OVI moving average behavior for the top 1000 stocks by market cap.
See how the green undulations correlate with the white line (the S&P 500 index) over the past 12-months. We are thoroughly investigating this quantitatively to make sure we’re not over-fitting my observations, but at first glance it looks pretty compelling and with the study.
Combined with the fact that this ‘pie’ is small (out of small, medium large), and my own observations as I trawl through hundreds of individual stocks, it confirms to me that OVI participation in this rally is actually weakening.
This suggests to me that the rally will weaken.The question is … when?!My answer is within a matter of weeks. I’ll get more precise on that when price action starts to confirm.And all this is perfect in the broader context of the likelihood that we are in a multi-month basing environment.
From last week:
My assessment is that dark clouds still loom large over the market, and that the indices will stall at or below their 200-dma’s, which will then result in the extension of the basing action.
It’s always worth repeating … I’m using the exact same tools that you’re using in terms of Market Timing and Stock Selection via my applications.
Current Market Behavior:
The S&P and the Dow are forming bull flags, which would normally signify optimism. And there may be yet one more leg up – remember, TWYS (trade what you see). But beware and be aware of my comments above.
Indeed, there are many bull flags showing right now, but I also see signs of non-participation and imminent exhaustion.
Now, it’s entirely possible that the non-participation is down to the fact that we’re in the summer holidays and participation is naturally lower than normal.
But my assessment is that by the end of September (likely much sooner) we’ll be in a down leg at least back down to the 50-dma.
And again, remember, this is all part of the broader basing that we’ve spoken about, and so it’s entirely expected.
—
Market Timers:
As I predicted last week, my Longer Term Market Timer, the OVIsi has indeed moved back to amber.
The Medium Term Swing Timer remains in positive territory and not quite officially overbought (though it got close). Used correctly this is a very effective indicator.
In the meantime, the Short Term Timer made a has made another up arrow bar. While the Short Term Timer has a very creditable record overall, its optimal use is with discretion and I have improvements planned for it, which is why I’m not putting too much emphasis on it at this time.
Last week the SPY OVI had been looking far healthier, suggesting further upside in the short term, but it has subsided somewhat in line with the other main indices OVIs which are tepid.
Market Outlook:
If we do get another leg up in this rally, I am confident it will be the final one before the next downswing.
As such, there are bullish and bearish setups to consider.
Stock Selection Using Our Fast Filters:
Today, I have used a number of my Fast Filters, and I’ve gone through the list several times.
While my commentary involves a big list, here is a smaller segment that you can focus on (note the mix of bullish and bearish names here):
AFL BEAM CCJ CF CHD CRM DOCS EA FITB HD HTZ INTC IRM J MARA MTCH PCAR PRLB PYPL SHW SLCA SNA TRU UHS USB WCN
Software Upgrades
Brace yourself this autumn for a flurry of activity! Very soon you can expect data improvements, an integrated newsfeed, further refinements and a critical update to the OptionEasy Analyzer.
Events
I can see that people are already securing their hotel rooms for Miami 2023. If you’re planning to go, please secure your preferential hotel rate now because it is a certainty that they will fill up and the room rates will rise.
This year’s Stocks Summit is confirmed for 3rd December at the London Courtyart Marriott Heathrow, as per last year. More details will follow in the coming days.
—
Remember, you can play the video at 1.25x or 1.5x speed if you want to save time! I have placed all the stocks covered in today’s review in your “Latest Preview” watch list.